🔥 Automatic expense categorisation is here! No more sorting invoices by hand.Show me →

 English
 Čeština
 Slovenčina
Restaurant P&L software for operators
Stop waiting four weeks for your P&L. Dishboard pulls live data from your POS, invoices and payroll into a real-time profit and loss statement — broken down by week, location and cost line. Built for restaurants, pubs, and hospitality groups.
Schedule a demo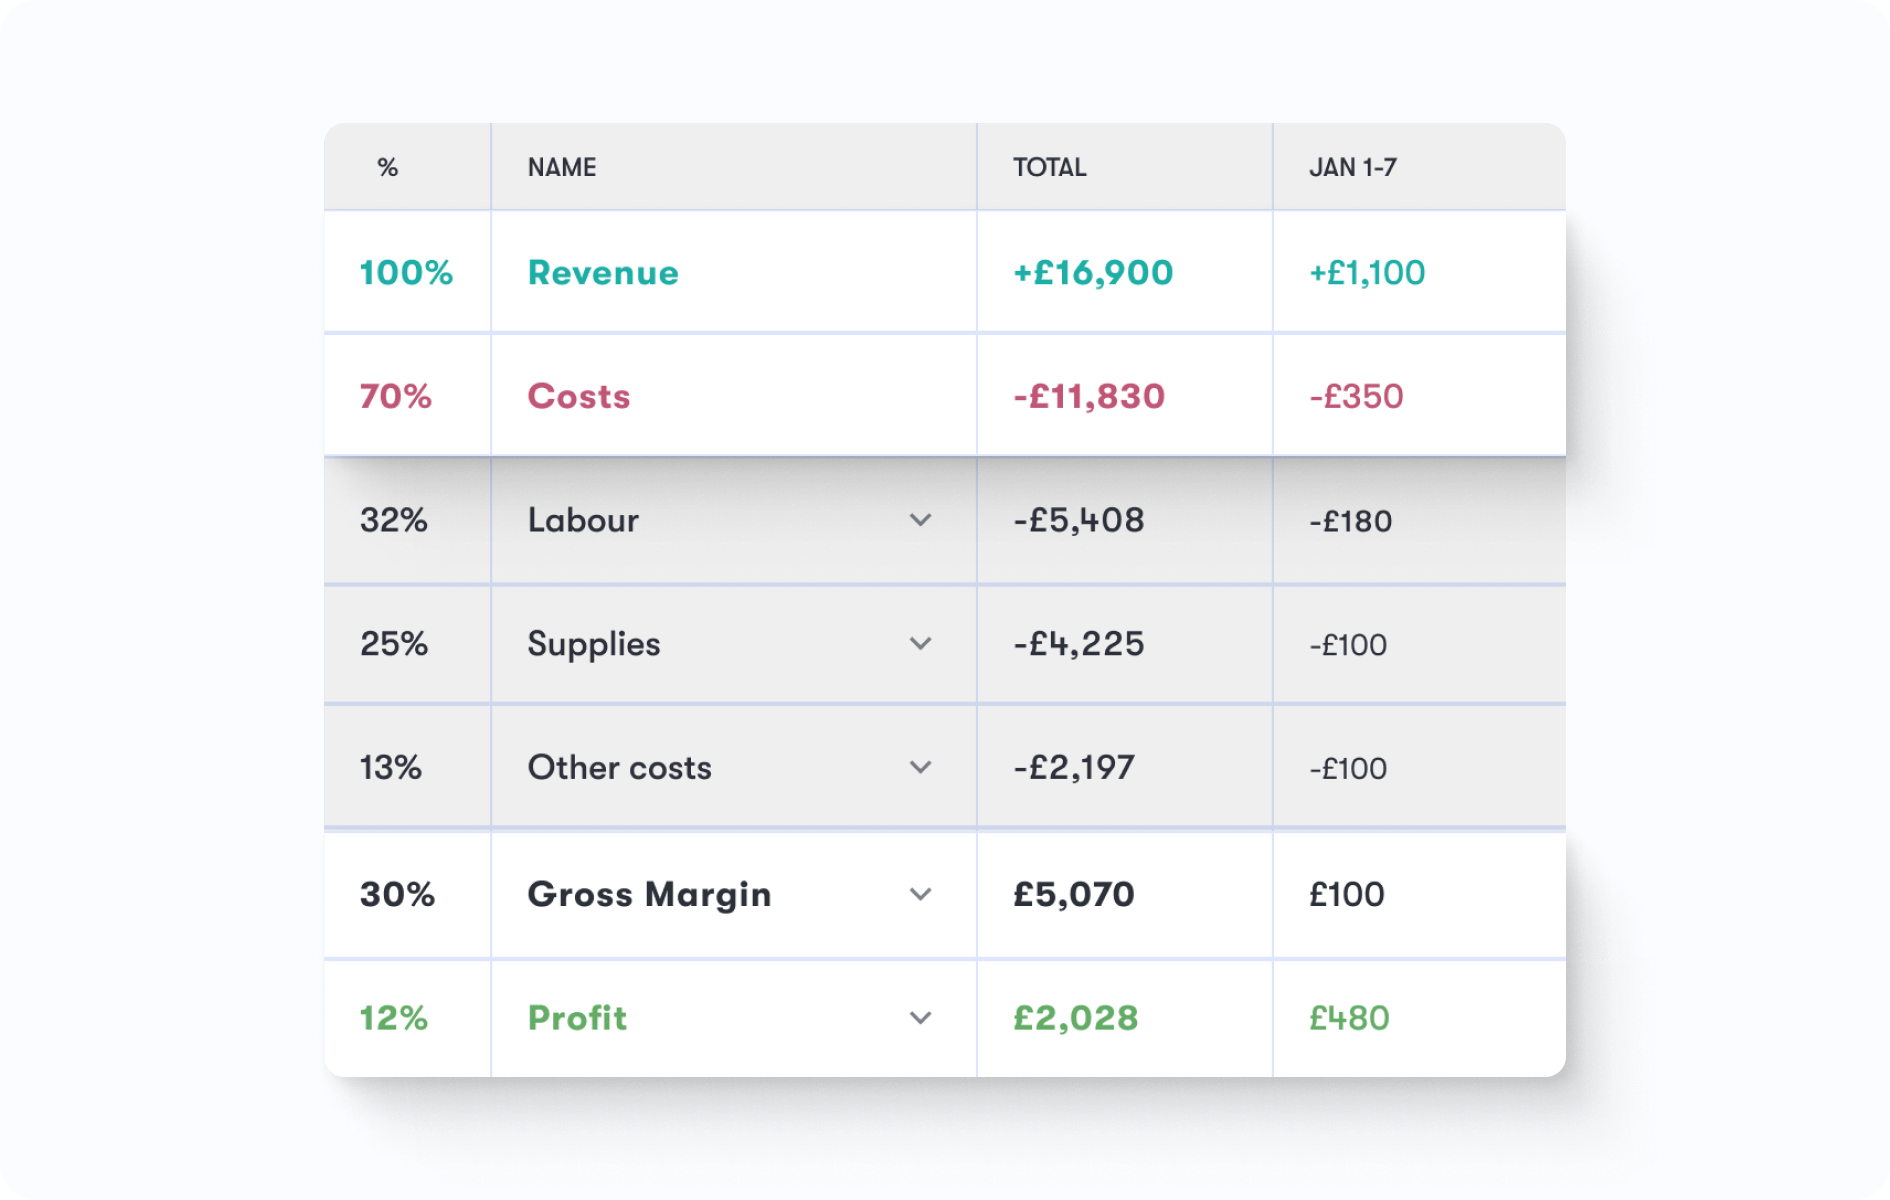






Why your P&L arrives 4 weeks too late
By the time most operators read their P&L, the month they're looking at is already history. Sales sit in the POS, costs lie hidden in stacks of invoices while wages live in payroll — and nothing connects until someone manually pulls it together. Real restaurant financial management software shouldn't make you wait.

Delayed access to data
By the time your accountant delivers your numbers at the end of the month, the damage is done.

Requires time for updating
Spreadsheet P&L reporting takes up between 15-20 hours/month and still lag behind reality.

Scattered data sources
Half your costs live in your POS, half is buried in stacks of invoices, the rest in payroll — none talk to each other.
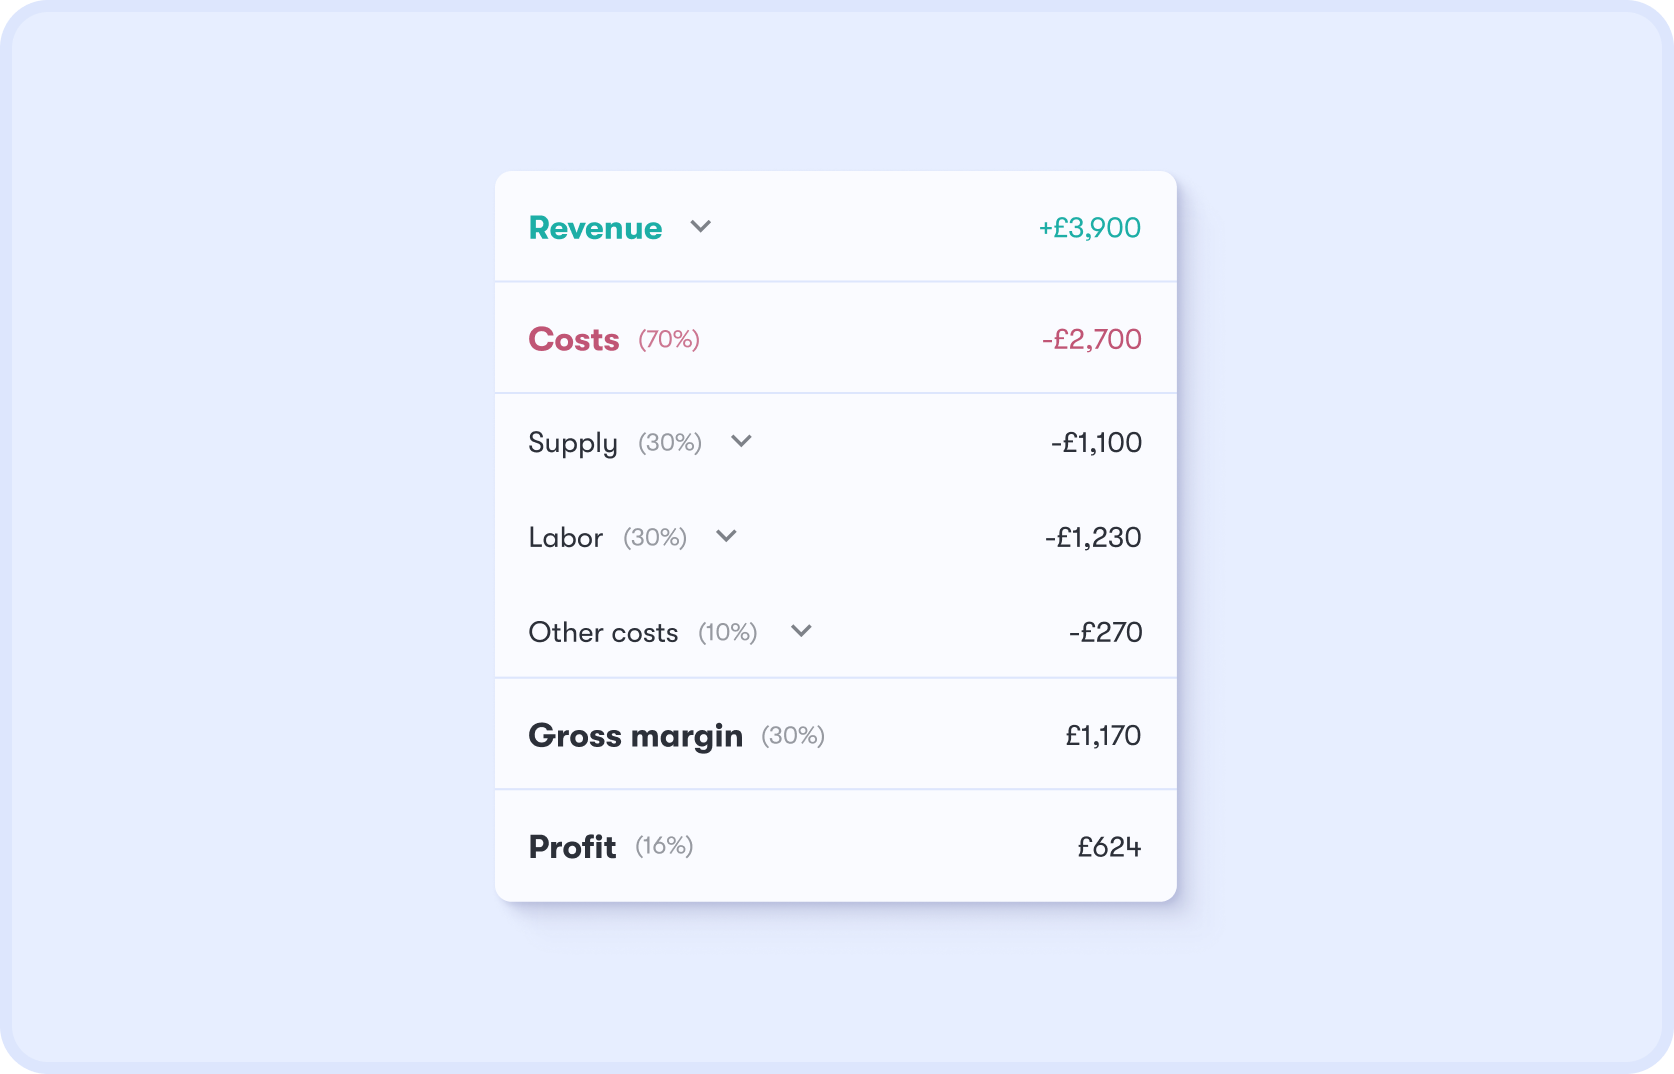
Real-Time P&L. Always Current.
Your Profit and Loss report on Dishboard gets updated after every shift. Yesterday's revenue, food and labour costs and net profit — visible immediately at your fingertips, no need to wait for next month's report. The financial dashboard for your restaurants sits on one screen.
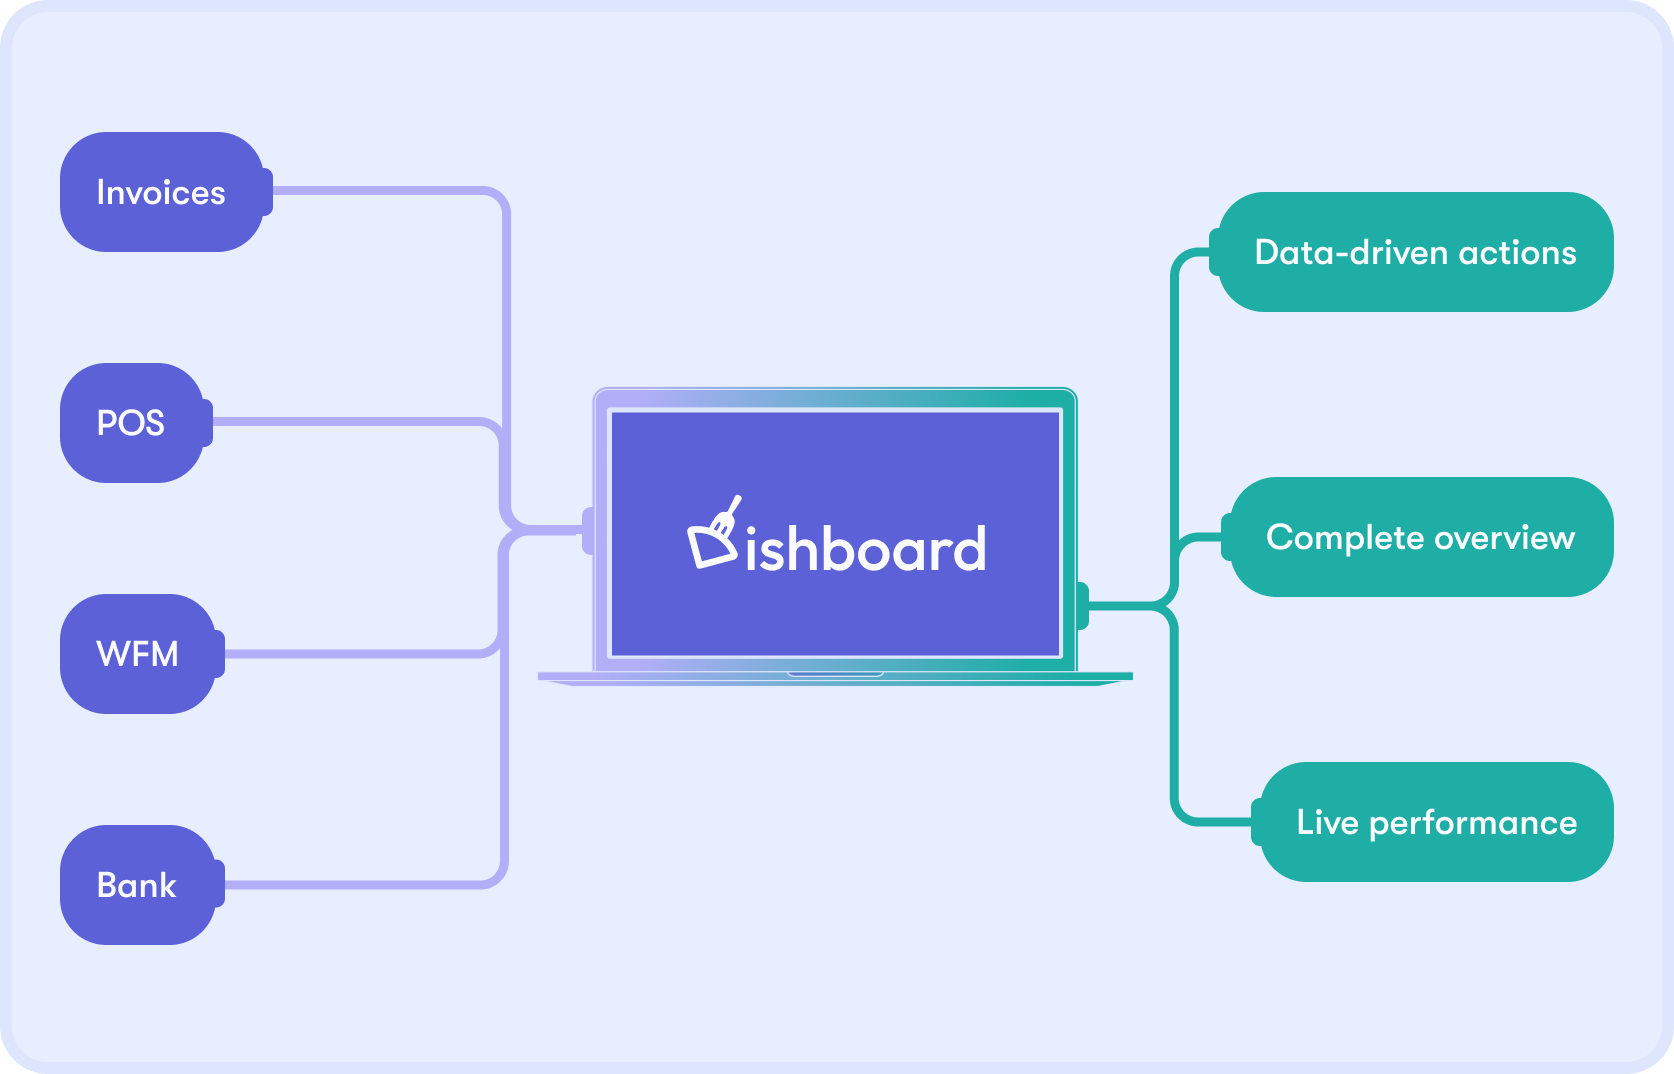
Dishboard consolidates all of your data
Three data sources, one P&L. Costs arrive through our AI invoice scanner while wages come in from workforce management software — and Dishboard categorises everything in the background. No exports, no copy-paste, no chasing managers for numbers.
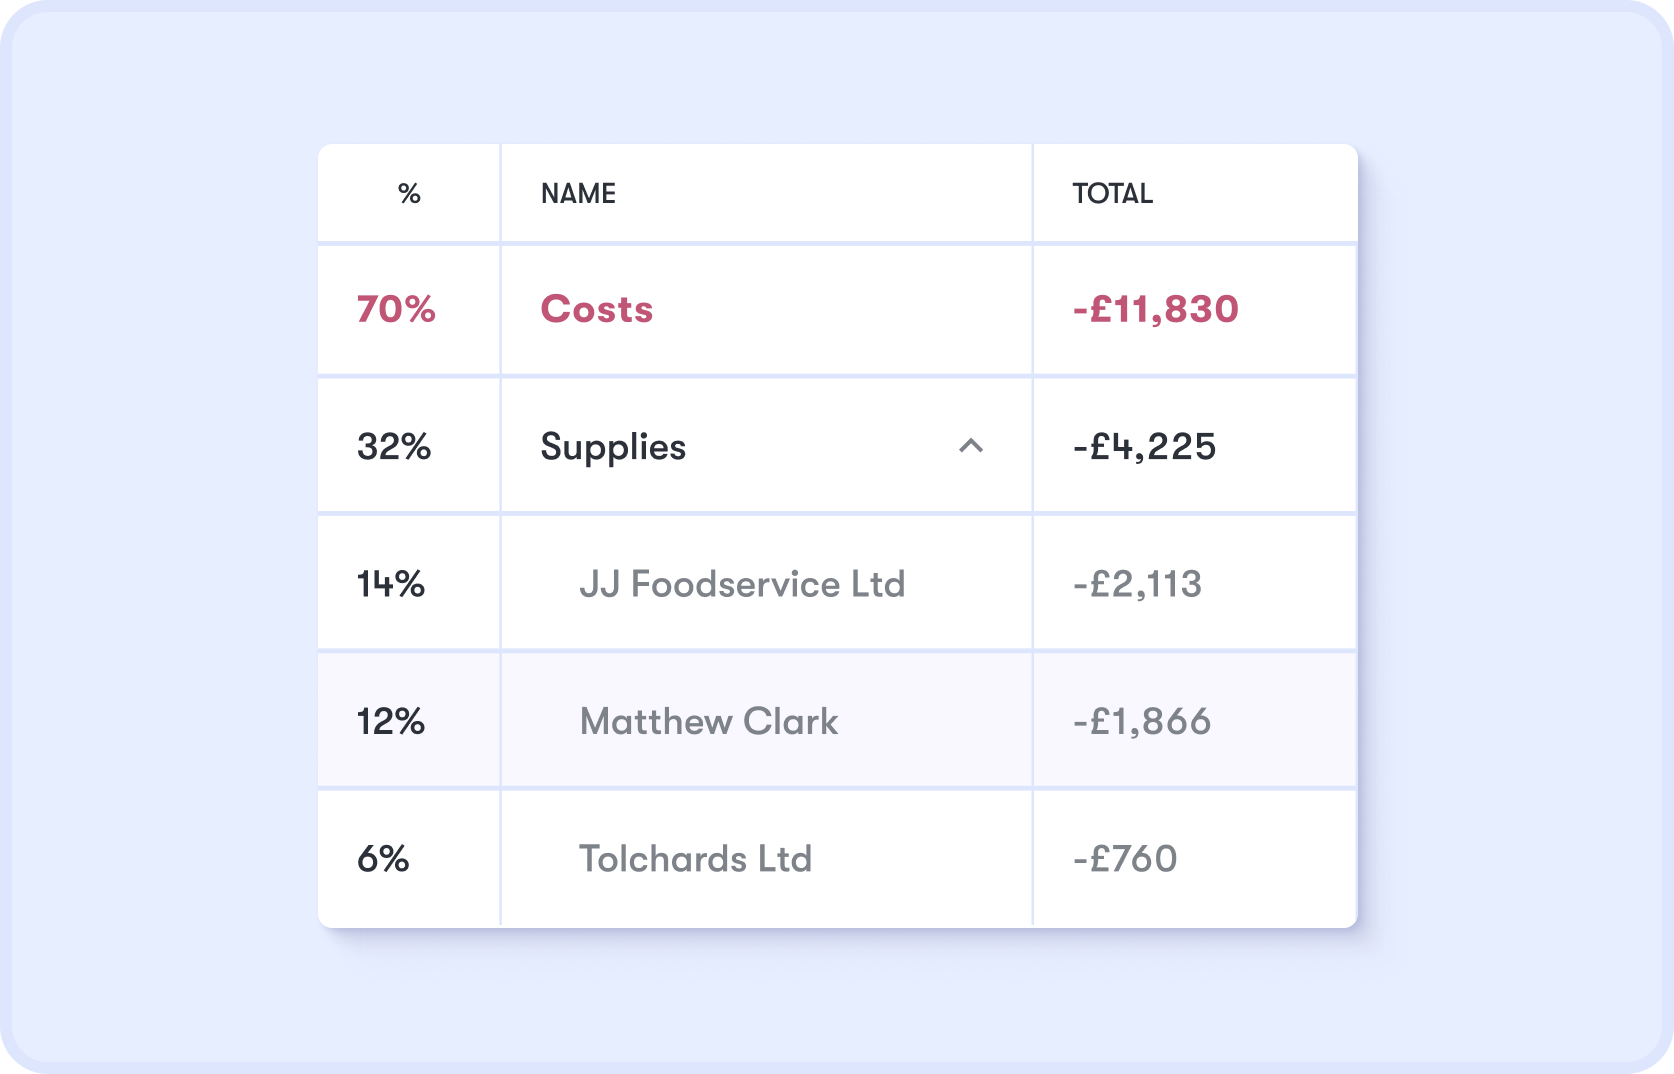
Every cost line, drill-down to the line item
Your standard P&L tells you what happened, Dishboard tells you why. Click on any of the cost lines and see the supplier, the invoice and the line item that impacted it — separating fixed vs variable costs cleanly along the way.
Prime Cost and GP margin — the numbers operators care about
Prime cost and gross profit margin play a significant role in hospitality today. Dishboard tracks both live, alongside net profit, break-even point and EBITDA — the metrics that actually decide whether the business is healthy.
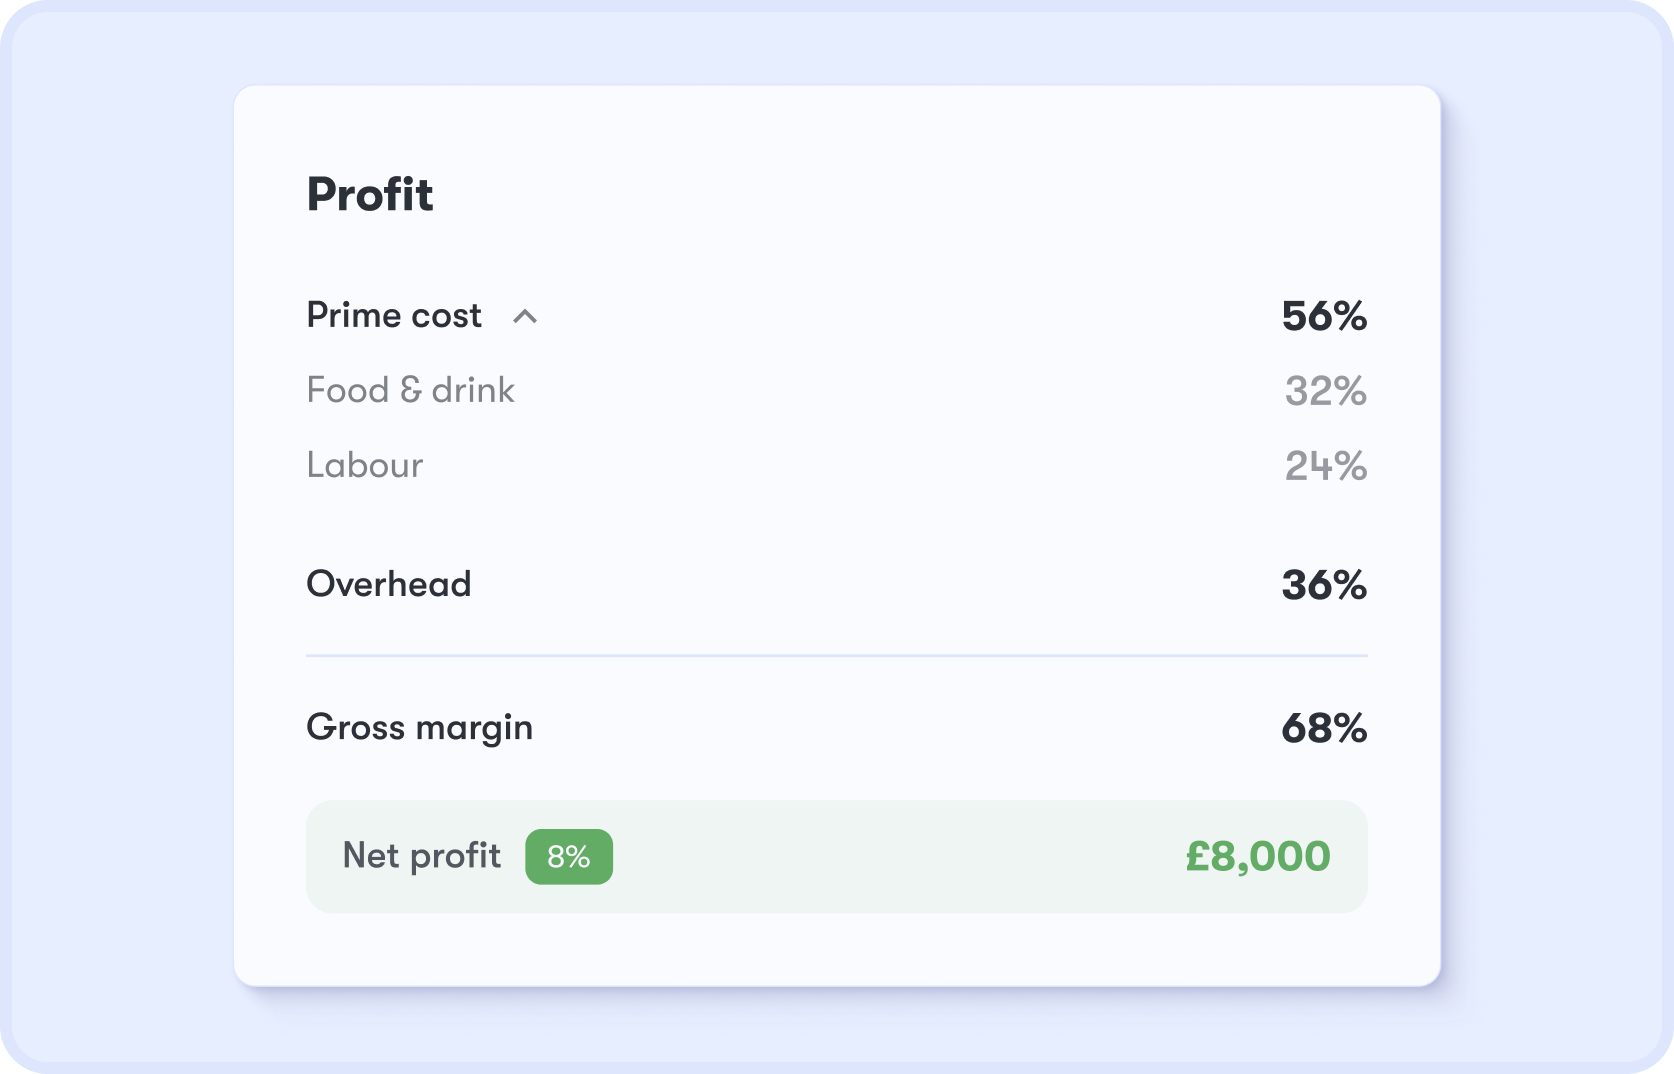
Do you have a healthy P&L?
There's no one-size-fits-all P&L. But across the industry, the healthy zone, the watch zone and the crisis zone are remarkably consistent. Use the table below to see how your metrics fare.
| Metric | Healthy | Watch zone | Crisis |
|---|---|---|---|
| Food cost % | 28-32% | 33-35% | 36%+ |
| Drink cost % | 18-22% | 23-25% | 26%+ |
| Labour cost % | 25-32% | 33-37% | 38%+ |
| Prime cost | <60% | 60-65% | 65%+ |
| GP margin | 65-70% | 60-65% | <60% |
| Net profit (UK avg 3-5%) | 6-10% | 3-5% | <3% |

Restaurants in the UK average just 3-5% net profit margin (sources: UKHospitality, Sage hospitality benchmarks, ONS). The difference between a struggling site and a thriving one isn't revenue — it's whether prime cost stays below 60%. Dishboard gives you this insight instantly — no waiting for your accountant's monthly report.

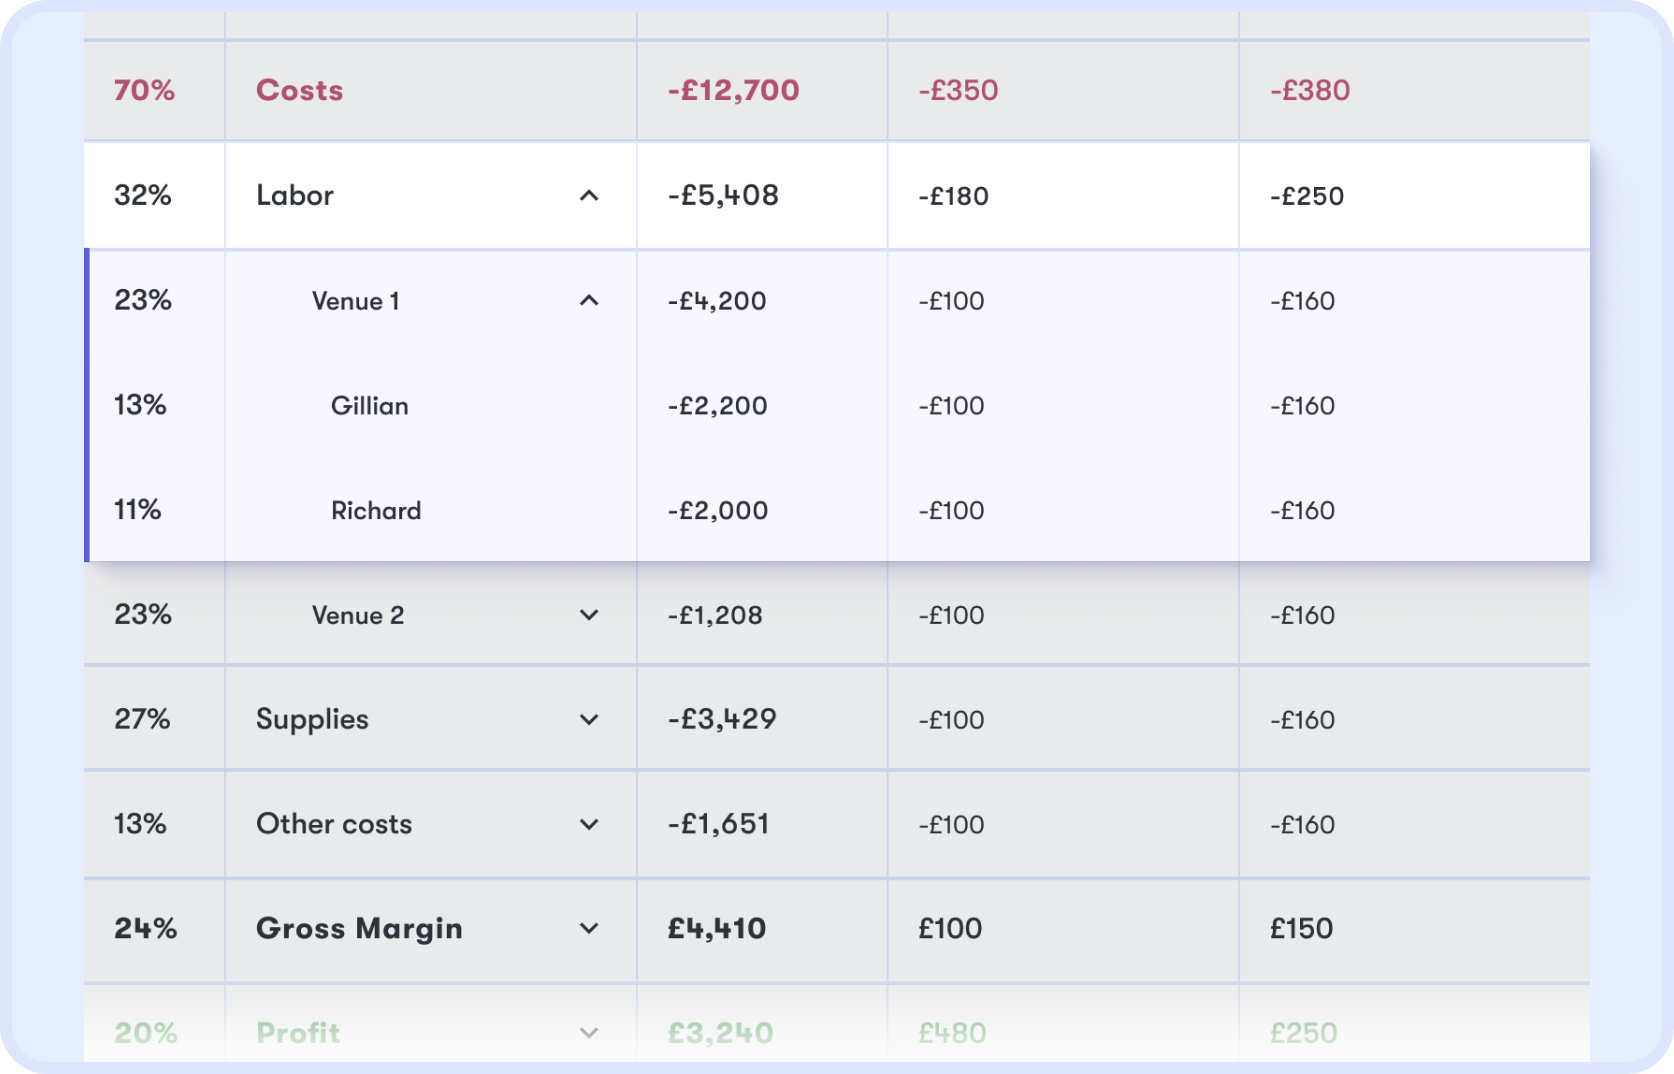
Run multiple sites? One dashboard, every location
Consolidate all of your sites in one dashboard. Group-level reporting for the board, venue-level reporting for the operator and a side-by-side venue comparison for the Head of Ops. One clean export for the accountant whenever they need it.
Built around how restaurants actually operate
Built for the realities of UK hospitality — VAT splits, Making Tax Digital, and the accounting stack operators actually use. Dishboard works with your accountant, not instead of them.

Handles VAT on food (0% / 20% split)
Hot food, cold food, eat-in, takeaway — Dishboard separates the rates so the books stay clean for HMRC.

Making Tax Digital (MTD) compliant — exports for your bookkeeper
Reports come out in formats your bookkeeper can drop straight into MTD-compliant filings.

Works with your accountant, not instead of them.
While your accountant still files your returns, Dishboard gives you a live picture of how your business is performing — and a clean export whenever they need it.

British English, £, HMRC-friendly reporting
Built in £ from day one. No US-defaults to translate, no currency conversions to second-guess.
Dishboard vs spreadsheets vs your accountant vs all-in-one POS
There are four common ways UK operators get their hands on a P&L. Here's how each of them compares — including ours, honestly.
 | Spreadsheet | Accountant (monthly) | All-in-one POS | |
|---|---|---|---|---|
| Time to first P&L | Same day | 2-3 weeks setup | 4 weeks | Built-in but limited |
| Data updates | Live, every shift | Manual entry | Monthly | Daily, basic only |
| Line-item drill-down | Yes (to invoice line) | Manual reconciliation | No | No |
| Cost | One flat fee per site | Free + your time | £200-800/mo | Locked into POS contract |
See how restaurants use Dishboard to stay profitable
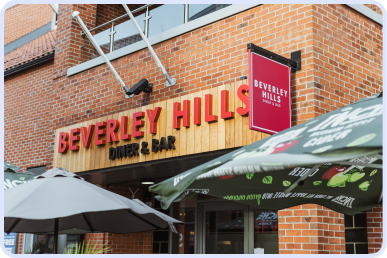
How Beverley Hills Diner & Bar saved £1,300 and cut finance time by hours
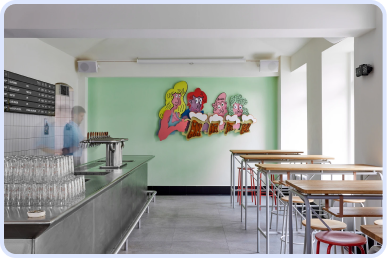
How Ive from Bistro Lagom Eliminated 15 Spreadsheets

Frequently Asked Questions
Three data feeds — POS, AI invoice scanning and payroll — flow into one P&L automatically. Sales come from the till, costs come from supplier invoices, labour comes from your payroll. Categorisation happens in the background, so you see a finished P&L instead of building one.
No. Dishboard is back-office reporting, not bookkeeping. Your accountant still files VAT, year-end accounts and HMRC returns — Dishboard just gives you the live picture between those filings, and produces clean exports your accountant can use.
POS reports only show the sales side. Dishboard combines POS sales with supplier costs and payroll, so you get a real P&L — gross profit, prime cost, net profit — not just revenue.
Yes. The P&L is live, so you can read this week's numbers on Monday morning instead of waiting four weeks for the accountant's report.
Dishboard separates 0% and 20% VAT lines automatically based on the invoice. Hot food, cold food, eat-in, takeaway — all handled correctly for HMRC reporting.
Yes. Drink cost and pour cost are tracked separately from food, so wet-led venues get the metrics that actually matter to them — not a food-restaurant template forced onto a pub P&L.
Yes. Multi-location accounts give you a P&L per venue and a consolidated view across the whole group, with side-by-side comparison and one clean export for your accountant.
Most accounts are live within a day. POS, payroll and accounting integrations connect via API; supplier invoices flow in from the next billing cycle.
See how Dishboard can help you
We’ll get to know your business first, then guide you through:
- Our team will schedule a quick call to learn about your business.
- We’ll walk you through how Dishboard works, step by step.
- You’ll get answers to any questions on pricing, setup, and usage.
- Together we’ll see how Dishboard can fit in.
Thanks — your request is in!
We’ve got everything we need. Our team will be in touch shortly to book a time that works for you.
Or schedule a call right away!
Schedule a demoSee how Dishboard can help you
We’ll get to know your business first, then guide you through:
- Our team will schedule a quick call to learn about your business.
- We’ll walk you through how Dishboard works, step by step.
- You’ll get answers to any questions on pricing, setup, and usage.
- Together we’ll see how Dishboard can fit in.
Thanks — your request is in!
We’ve got everything we need. Our team will be in touch shortly to book a time that works for you.
Or schedule a call right away!
Schedule a demo